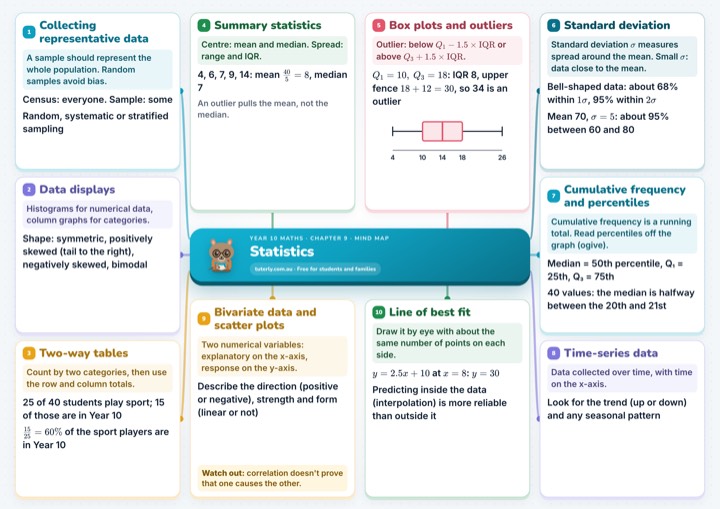
1Collecting representative data
A sample should represent the whole population. Random samples avoid bias.
Census: everyone. Sample: some
Random, systematic or stratified sampling
2Data displays
Histograms for numerical data, column graphs for categories.
Shape: symmetric, positively skewed (tail to the right), negatively skewed, bimodal
3Two-way tables
Count by two categories, then use the row and column totals.
25 of 40 students play sport; 15 of those are in Year 10
of the sport players are in Year 10
4Summary statistics
Centre: mean and median. Spread: range and IQR.
4, 6, 7, 9, 14: mean , median 7
An outlier pulls the mean, not the median.
5Box plots and outliers
Outlier: below or above .
: IQR 8, upper fence , so 34 is an outlier
6Standard deviation
Standard deviation measures spread around the mean. Small : data close to the mean.
Bell-shaped data: about 68% within , 95% within
Mean 70, : about 95% between 60 and 80
7Cumulative frequency and percentiles
Cumulative frequency is a running total. Read percentiles off the graph (ogive).
Median = 50th percentile, Q₁ = 25th, Q₃ = 75th
40 values: the median is halfway between the 20th and 21st
8Time-series data
Data collected over time, with time on the x-axis.
Look for the trend (up or down) and any seasonal pattern
9Bivariate data and scatter plots
Two numerical variables: explanatory on the x-axis, response on the y-axis.
Describe the direction (positive or negative), strength and form (linear or not)
Watch out: correlation doesn't prove that one causes the other.
10Line of best fit
Draw it by eye with about the same number of points on each side.
at :
Predicting inside the data (interpolation) is more reliable than outside it

Year 10 maths · Chapter 9 · Mind map
Statistics
tuterly.com.au · Free for students and families
See the full mind map
Free with your email, plus the A4 PDF to print.
In this chapter
- 9A Collecting representative data
- 9B Data displays
- 9C Two-way tables
- 9D Summary statistics
- 9E Box plots and outliers
- 9F Standard deviation
- 9G Cumulative frequency and percentiles
- 9H Time-series data
- 9I Bivariate data and scatter plots
- 9J Line of best fit
Practise it
Free worksheets with worked solutions: