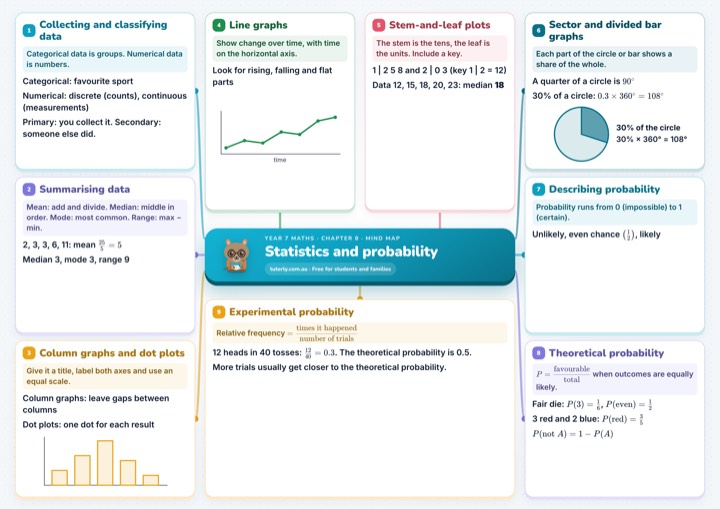
1Collecting and classifying data
Categorical data is groups. Numerical data is numbers.
Categorical: favourite sport
Numerical: discrete (counts), continuous (measurements)
Primary: you collect it. Secondary: someone else did.
2Summarising data
Mean: add and divide. Median: middle in order. Mode: most common. Range: max − min.
2, 3, 3, 6, 11: mean
Median 3, mode 3, range 9
3Column graphs and dot plots
Give it a title, label both axes and use an equal scale.
Column graphs: leave gaps between columns
Dot plots: one dot for each result
4Line graphs
Show change over time, with time on the horizontal axis.
Look for rising, falling and flat parts
5Stem-and-leaf plots
The stem is the tens, the leaf is the units. Include a key.
1 | 2 5 8 and 2 | 0 3 (key 1 | 2 = 12)
Data 12, 15, 18, 20, 23: median 18
6Sector and divided bar graphs
Each part of the circle or bar shows a share of the whole.
A quarter of a circle is
30% of a circle:
7Describing probability
Probability runs from 0 (impossible) to 1 (certain).
Unlikely, even chance , likely
8Theoretical probability
when outcomes are equally likely.
Fair die: ,
3 red and 2 blue:
9Experimental probability
Relative frequency
12 heads in 40 tosses: . The theoretical probability is 0.5.
More trials usually get closer to the theoretical probability.

Year 7 maths · Chapter 8 · Mind map
Statistics and probability
tuterly.com.au · Free for students and families
See the full mind map
Free with your email, plus the A4 PDF to print.
In this chapter
- 8A Collecting and classifying data
- 8B Summarising data
- 8C Column graphs and dot plots
- 8D Line graphs
- 8E Stem-and-leaf plots
- 8F Sector and divided bar graphs
- 8G Describing probability
- 8H Theoretical probability
- 8I Experimental probability
Practise it
Free worksheets with worked solutions: