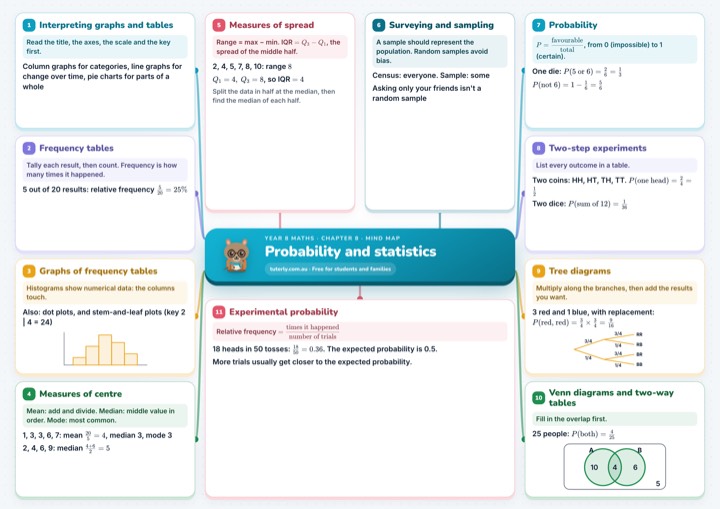
1Interpreting graphs and tables
Read the title, the axes, the scale and the key first.
Column graphs for categories, line graphs for change over time, pie charts for parts of a whole
2Frequency tables
Tally each result, then count. Frequency is how many times it happened.
5 out of 20 results: relative frequency
3Graphs of frequency tables
Histograms show numerical data: the columns touch.
Also: dot plots, and stem-and-leaf plots (key 2 | 4 = 24)
4Measures of centre
Mean: add and divide. Median: middle value in order. Mode: most common.
1, 3, 3, 6, 7: mean , median 3, mode 3
2, 4, 6, 9: median
5Measures of spread
Range = max − min. IQR , the spread of the middle half.
2, 4, 5, 7, 8, 10: range
, so IQR
Split the data in half at the median, then find the median of each half.
6Surveying and sampling
A sample should represent the population. Random samples avoid bias.
Census: everyone. Sample: some
Asking only your friends isn't a random sample
7Probability
, from 0 (impossible) to 1 (certain).
One die:
8Two-step experiments
List every outcome in a table.
Two coins: HH, HT, TH, TT.
Two dice:
9Tree diagrams
Multiply along the branches, then add the results you want.
3 red and 1 blue, with replacement:
10Venn diagrams and two-way tables
Fill in the overlap first.
25 people:
11Experimental probability
Relative frequency
18 heads in 50 tosses: . The expected probability is 0.5.
More trials usually get closer to the expected probability.

Year 8 maths · Chapter 8 · Mind map
Probability and statistics
tuterly.com.au · Free for students and families
See the full mind map
Free with your email, plus the A4 PDF to print.
In this chapter
- 8A Interpreting graphs and tables
- 8B Frequency tables
- 8C Graphs of frequency tables
- 8D Measures of centre
- 8E Measures of spread
- 8F Surveying and sampling
- 8G Probability
- 8H Two-step experiments
- 8I Tree diagrams
- 8J Venn diagrams and two-way tables
- 8K Experimental probability
Practise it
Free worksheets with worked solutions: